SimCity (NES) - All 1000 Maps!
Sun 17 Mar 2019, 17:55
I remember seeing sometime ago a website where all the SimCity for SNES maps were documented, so I decided to make the same thing but for the recently resurfaced NES version. I don't care if anyone else already did this, I wanna do this for fun.
How did I do this?
Well the game makes it pretty simple, because you can just spam A on the "Next Map" button and it goes through all of them. So I simply loaded the game up in an emulator with TAS capabilities, FCEUX, and then I started recording a movie while holding down Turbo A and I also set the emulation speed to 999%. Then I just waited for a couple of minutes and then I had a FCEUX movie of all the maps. You can find the FCEUX movie file here: simcity_maps.fm2.
Then I just used the built-in AVI dumping feature in FCEUX to make a video of it.
That video can be found on YouTube, upscaled to 4K:
Extracting The Maps
Then to get bitmaps of every map, I converted all the frames of the video into individual .bmp frames. I did this on the original video with the 256x224 resolution, so the bitmaps weren't huge. To get the video into individual frames I just used ffmpeg:
ffmpeg -i video.avi frames/%04d.bmp
Then I had to figure out how to extract all the frames where the map is actually seen. Unfortunately the time it takes for the game to generate a map varies, so I couldn't just extract a frame every n frames.
So I whipped up a Python script, getmapscreens.py, that just checks that the top left square of the map isn't black, and checks that the last square of the map isn't black, and then copies that frame to another folder with the map number as the name.
I let it run and after a while I had a .bmp file for every map screen.
After that I made another script that just extracts the actual map part, just_maps.py. I like having them separated so I can make sure the number in the corner actually is correct on the ones with the whole screen.
You can see all the maps in a list here: View.
Or if you want them all in a huge mess, try this one. It's kinda cool I think because the water sometimes matches each other.
Analyzing The Maps
To analyze the maps I made another script, analyze_maps.py, that uses the maps we extracted earlier.
It basically just counts how many pixels there are of each color, and spits out the result in a format that can be imported into Excel or similar software. You can find the resulting .CSV here: analyze.csv, or if you just want plain text: analyze.txt.
Maps With Least Amount of Water
| Map | Ground | Trees | Water | |
|---|---|---|---|---|
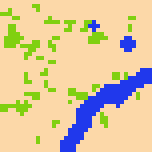 |
807 | 18448 | 2352 | 2304 |
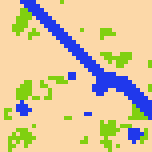 |
710 | 17728 | 2656 | 2720 |
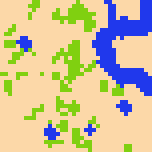 |
690 | 16496 | 3424 | 3184 |
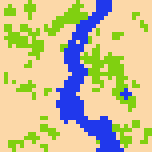 |
809 | 15344 | 4528 | 3232 |
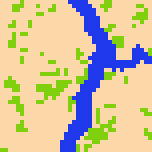 |
251 | 16688 | 3136 | 3280 |
In other words, the best map should be 807, because it has the least amount of water.
Even if someone else already did this (I'm not sure), this was a really fun little project and I hope to do something similar in the future. I learned a lot and had a blast.
If you haven't figured it out already, you can find all my goodies in here: simcitynesmaps/. You'll find the original bitmap files there in zips.